


Ask your data. Understand your business.
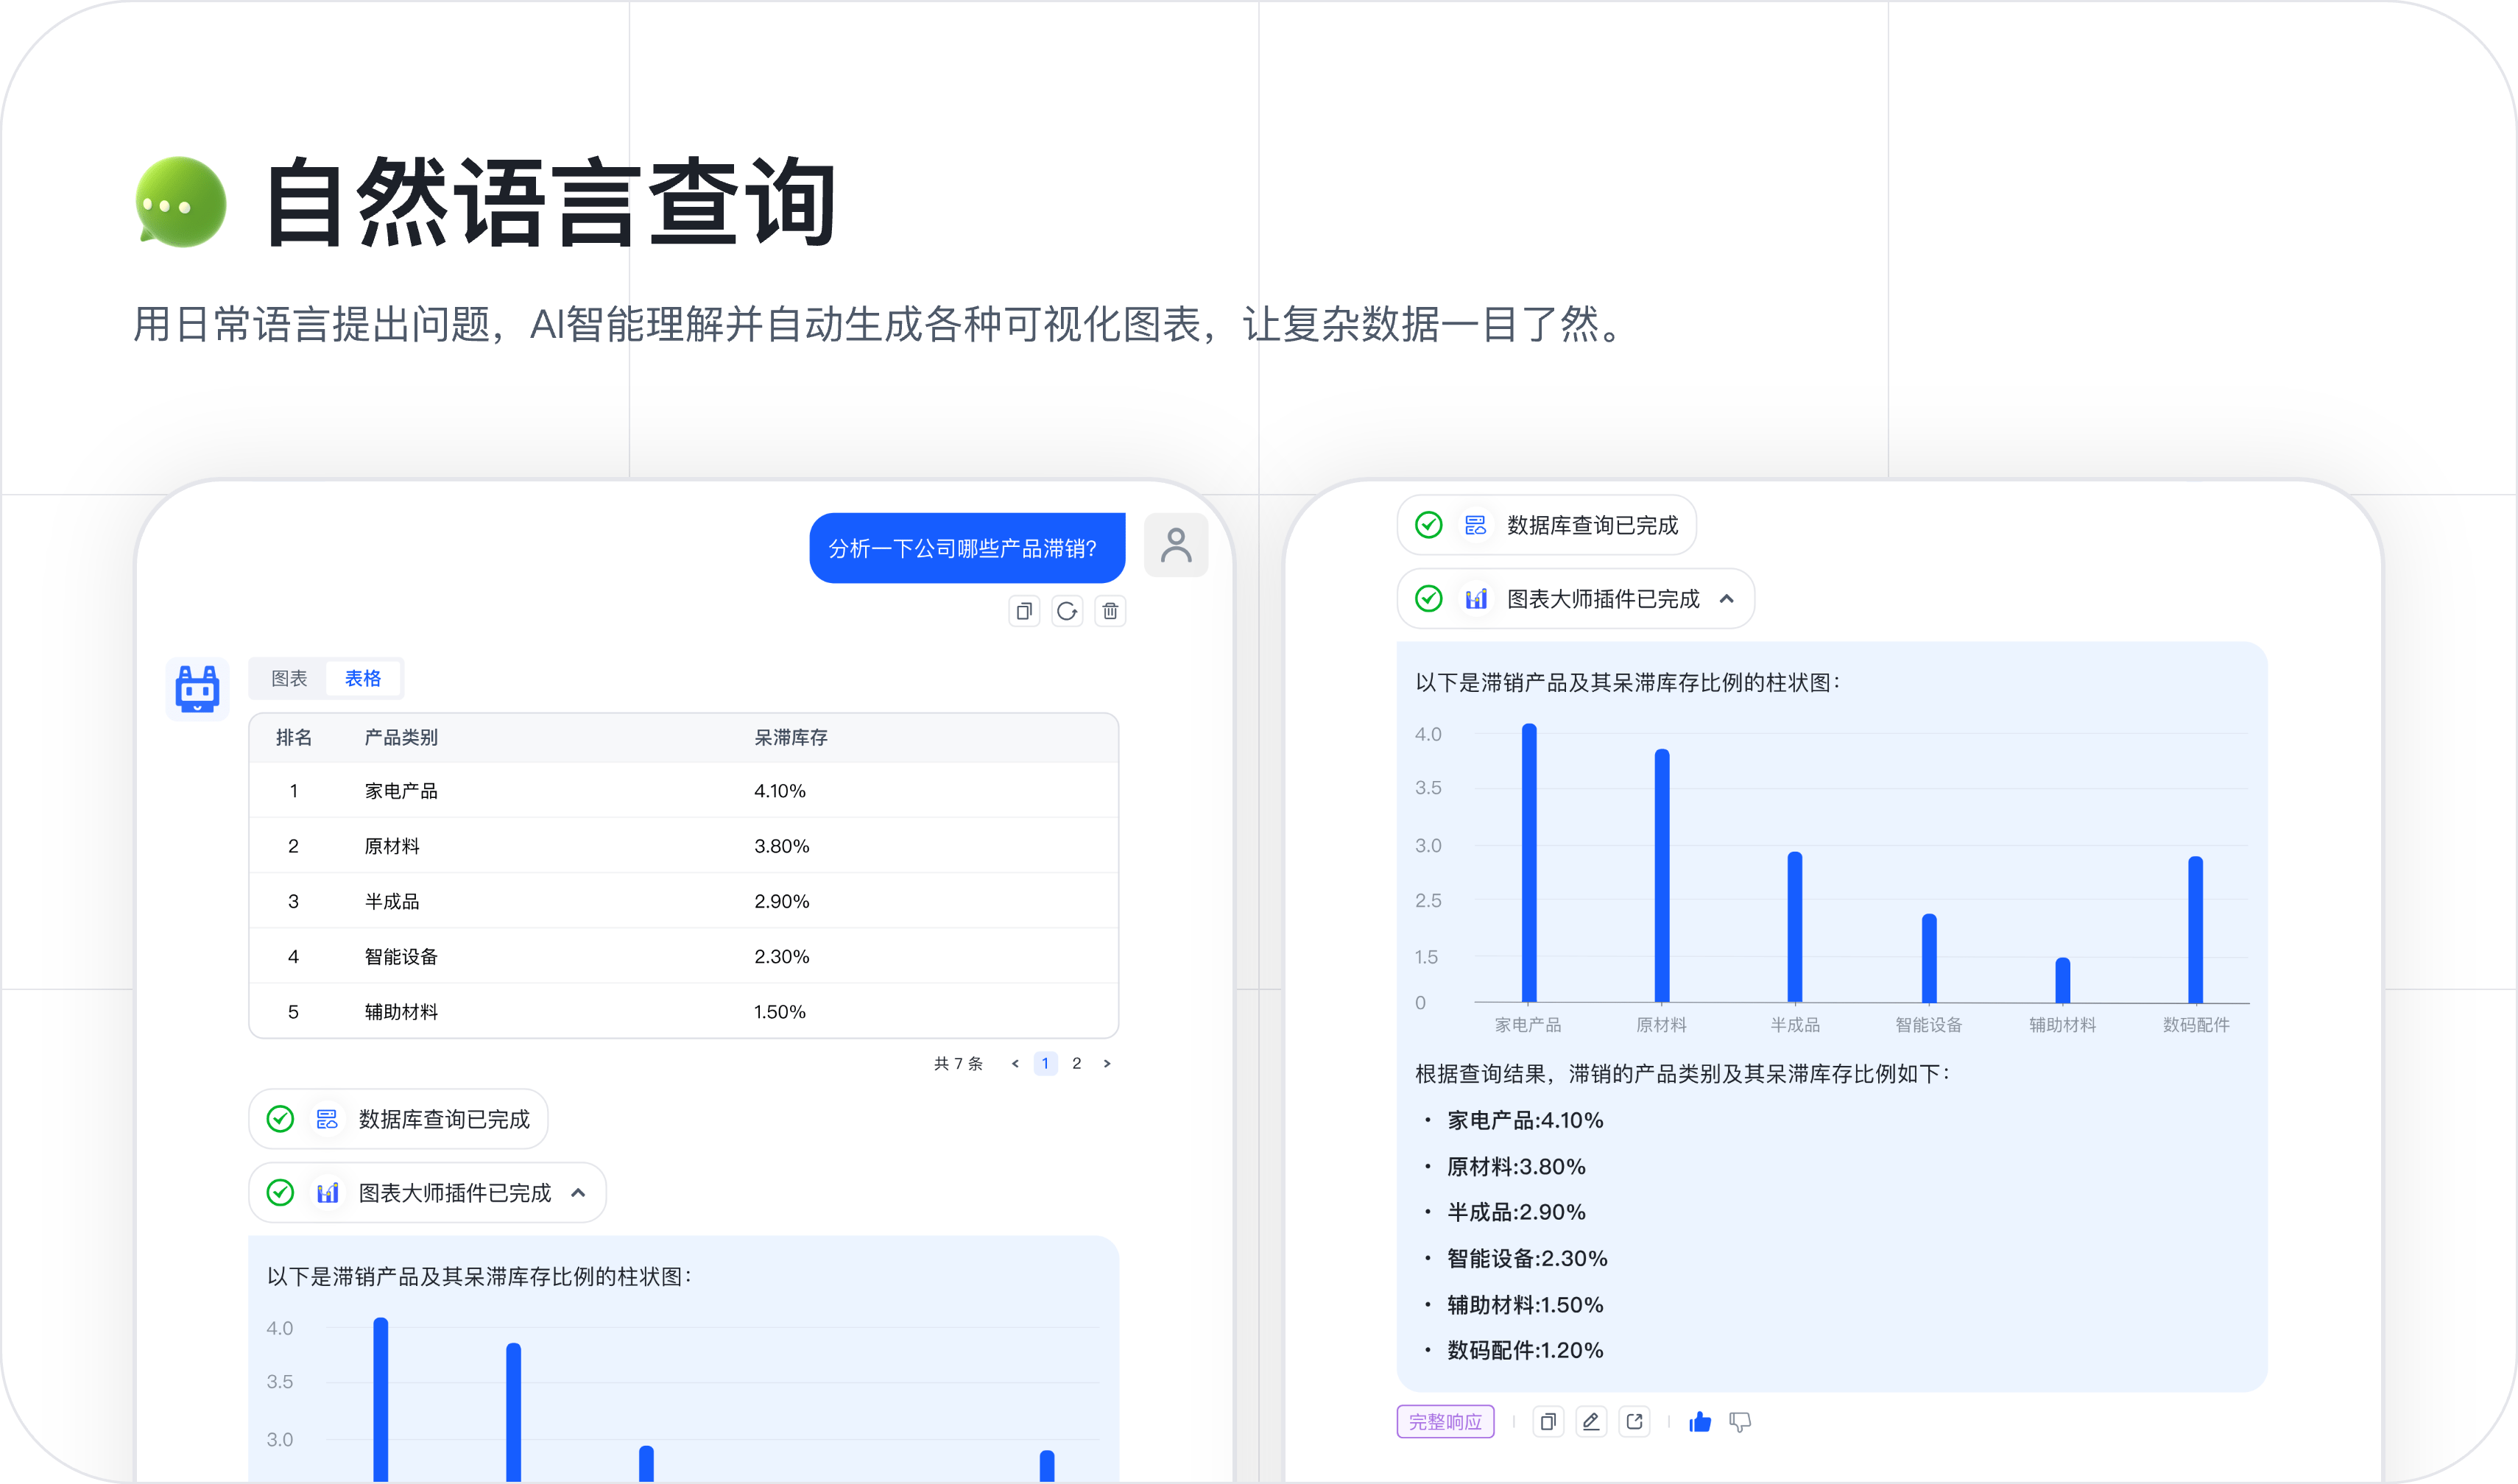
Connect your databases and ask questions in plain language. Chat2DB generates SQL and turns results into tables and charts, so your team can explore data without writing queries.
Built on the Jimo AI platform Explore the platform
Product screenshots show the Chinese interface.
From questions to better decisions
Give business teams a practical way to explore the data behind their decisions.

Connect your business data
Simpler queries. Faster decisions.
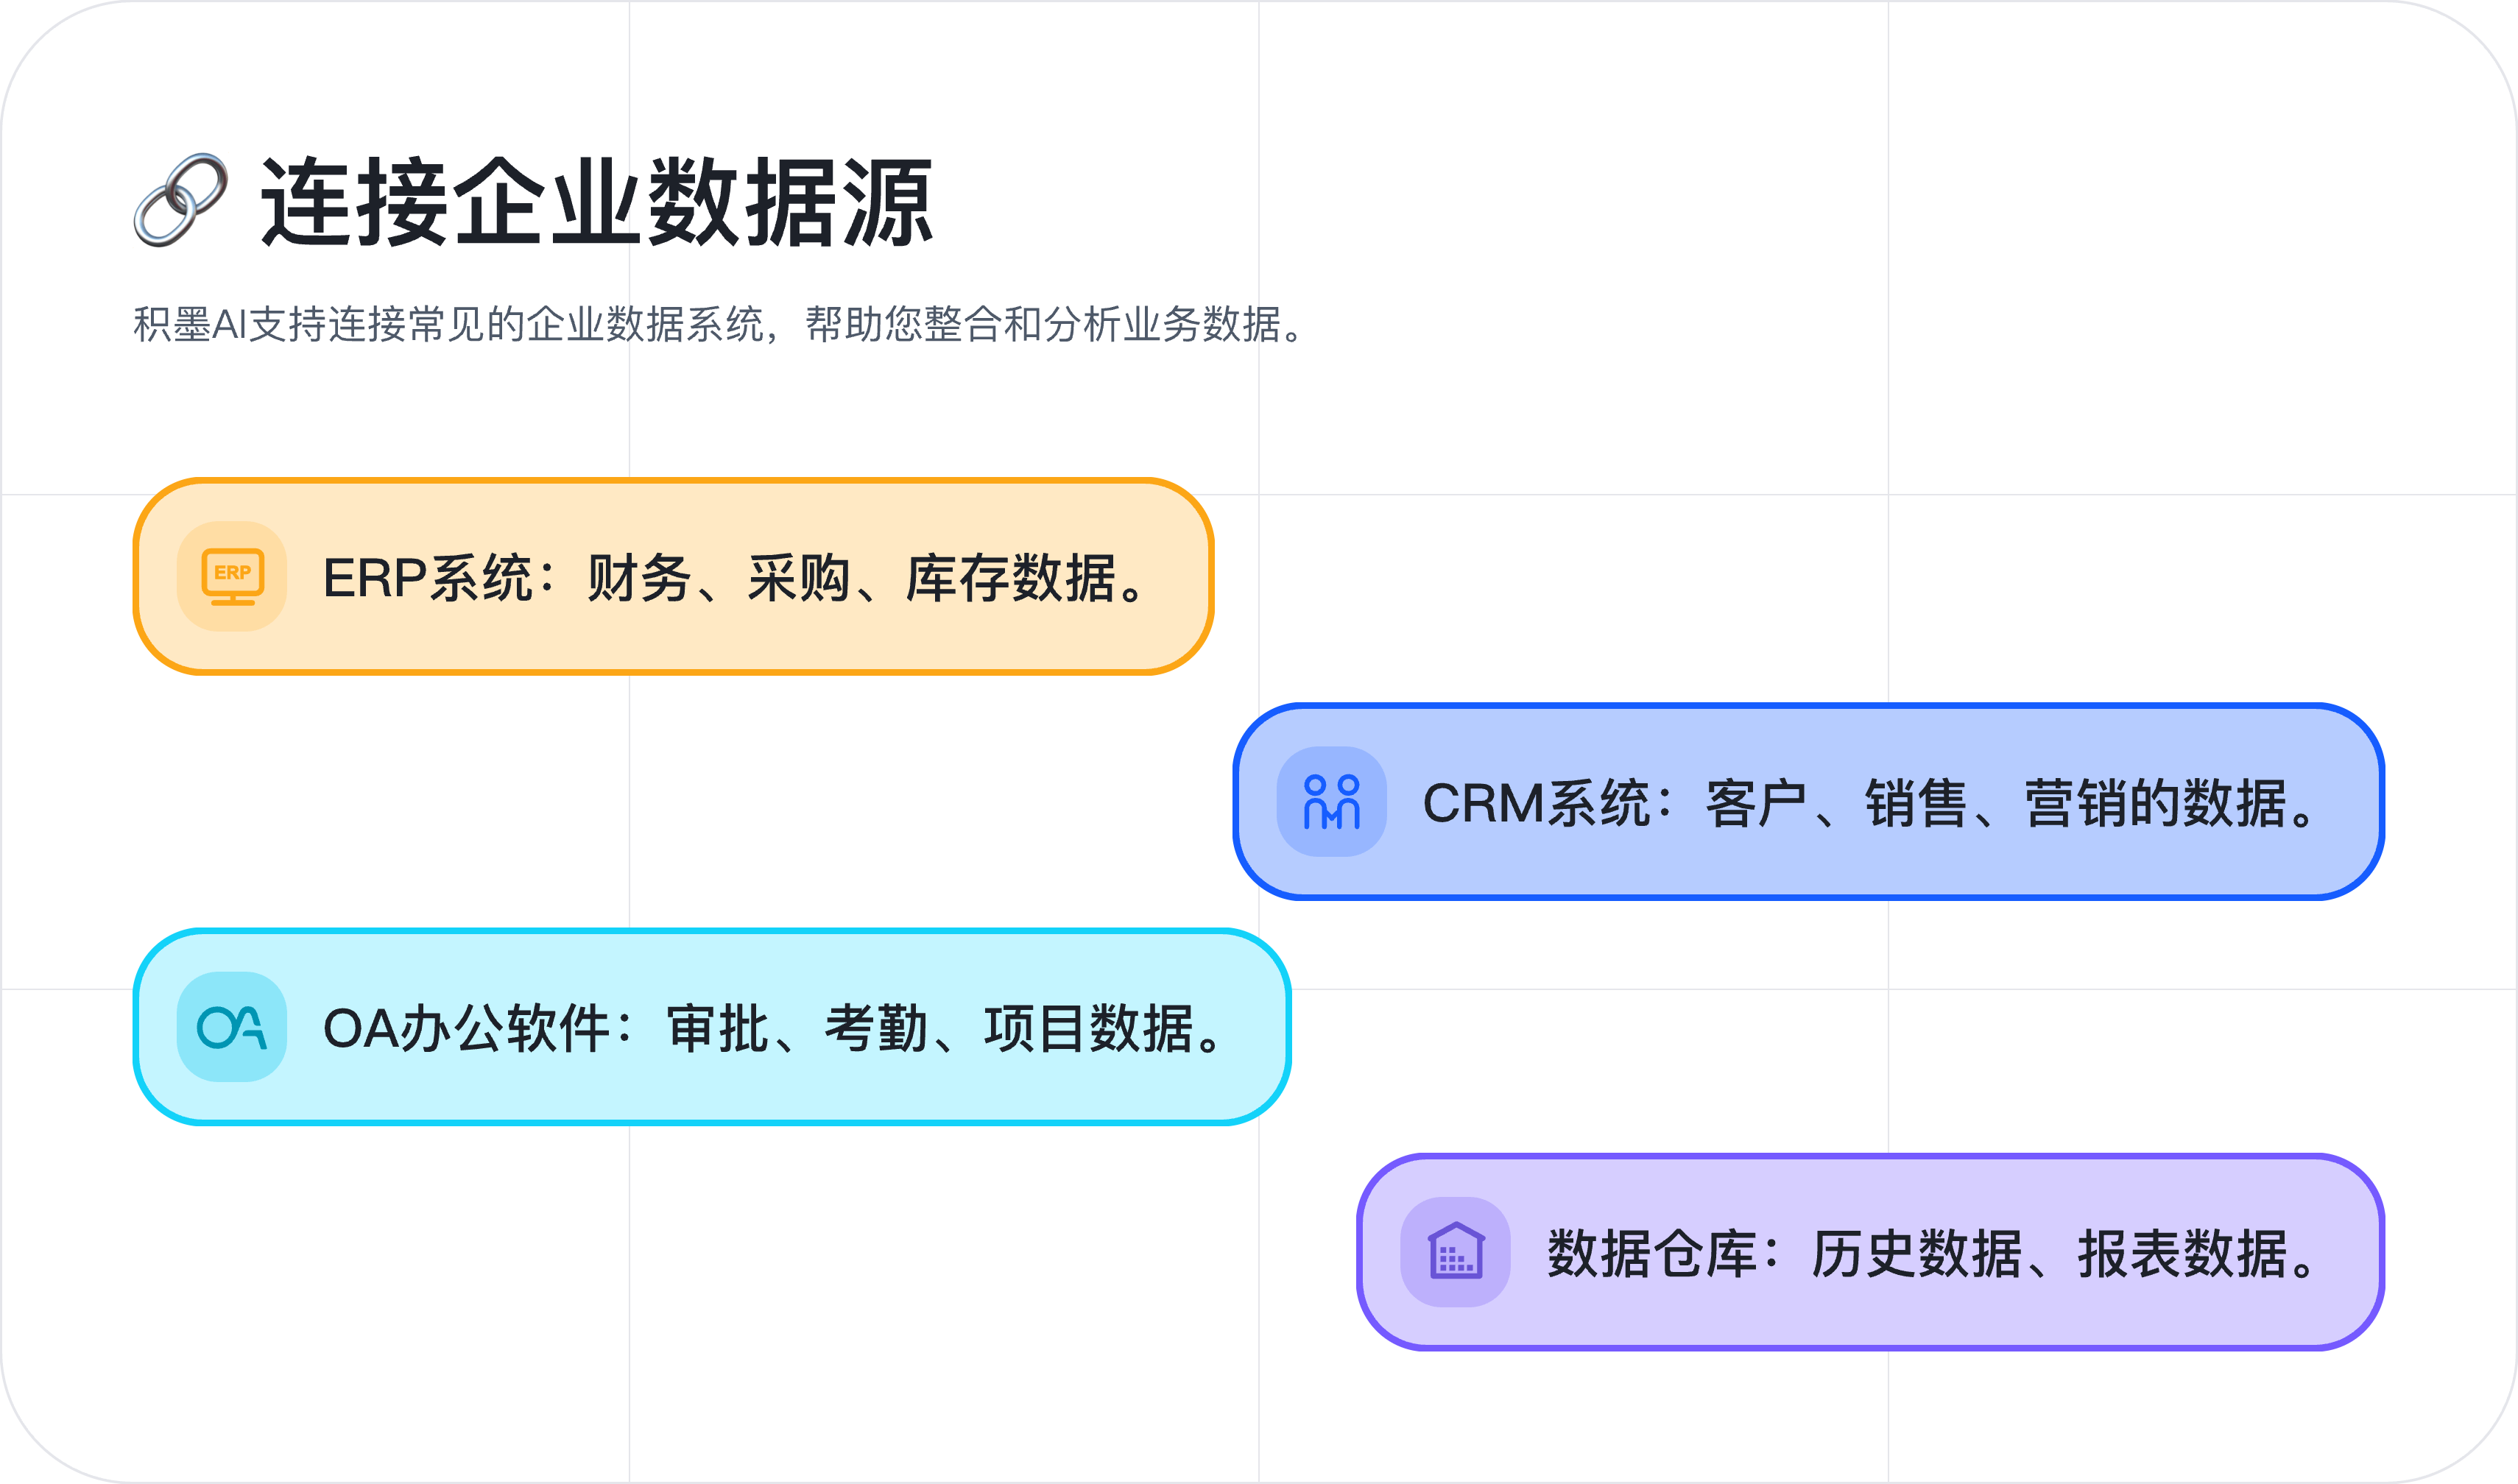
Connect to ERP, CRM, office systems and data warehouses, then explore your data through conversation.

Timely decision support
Explore data without waiting
Get the data you need to test ideas and act while the opportunity is still open.

Understand the results
Understand what your data is saying
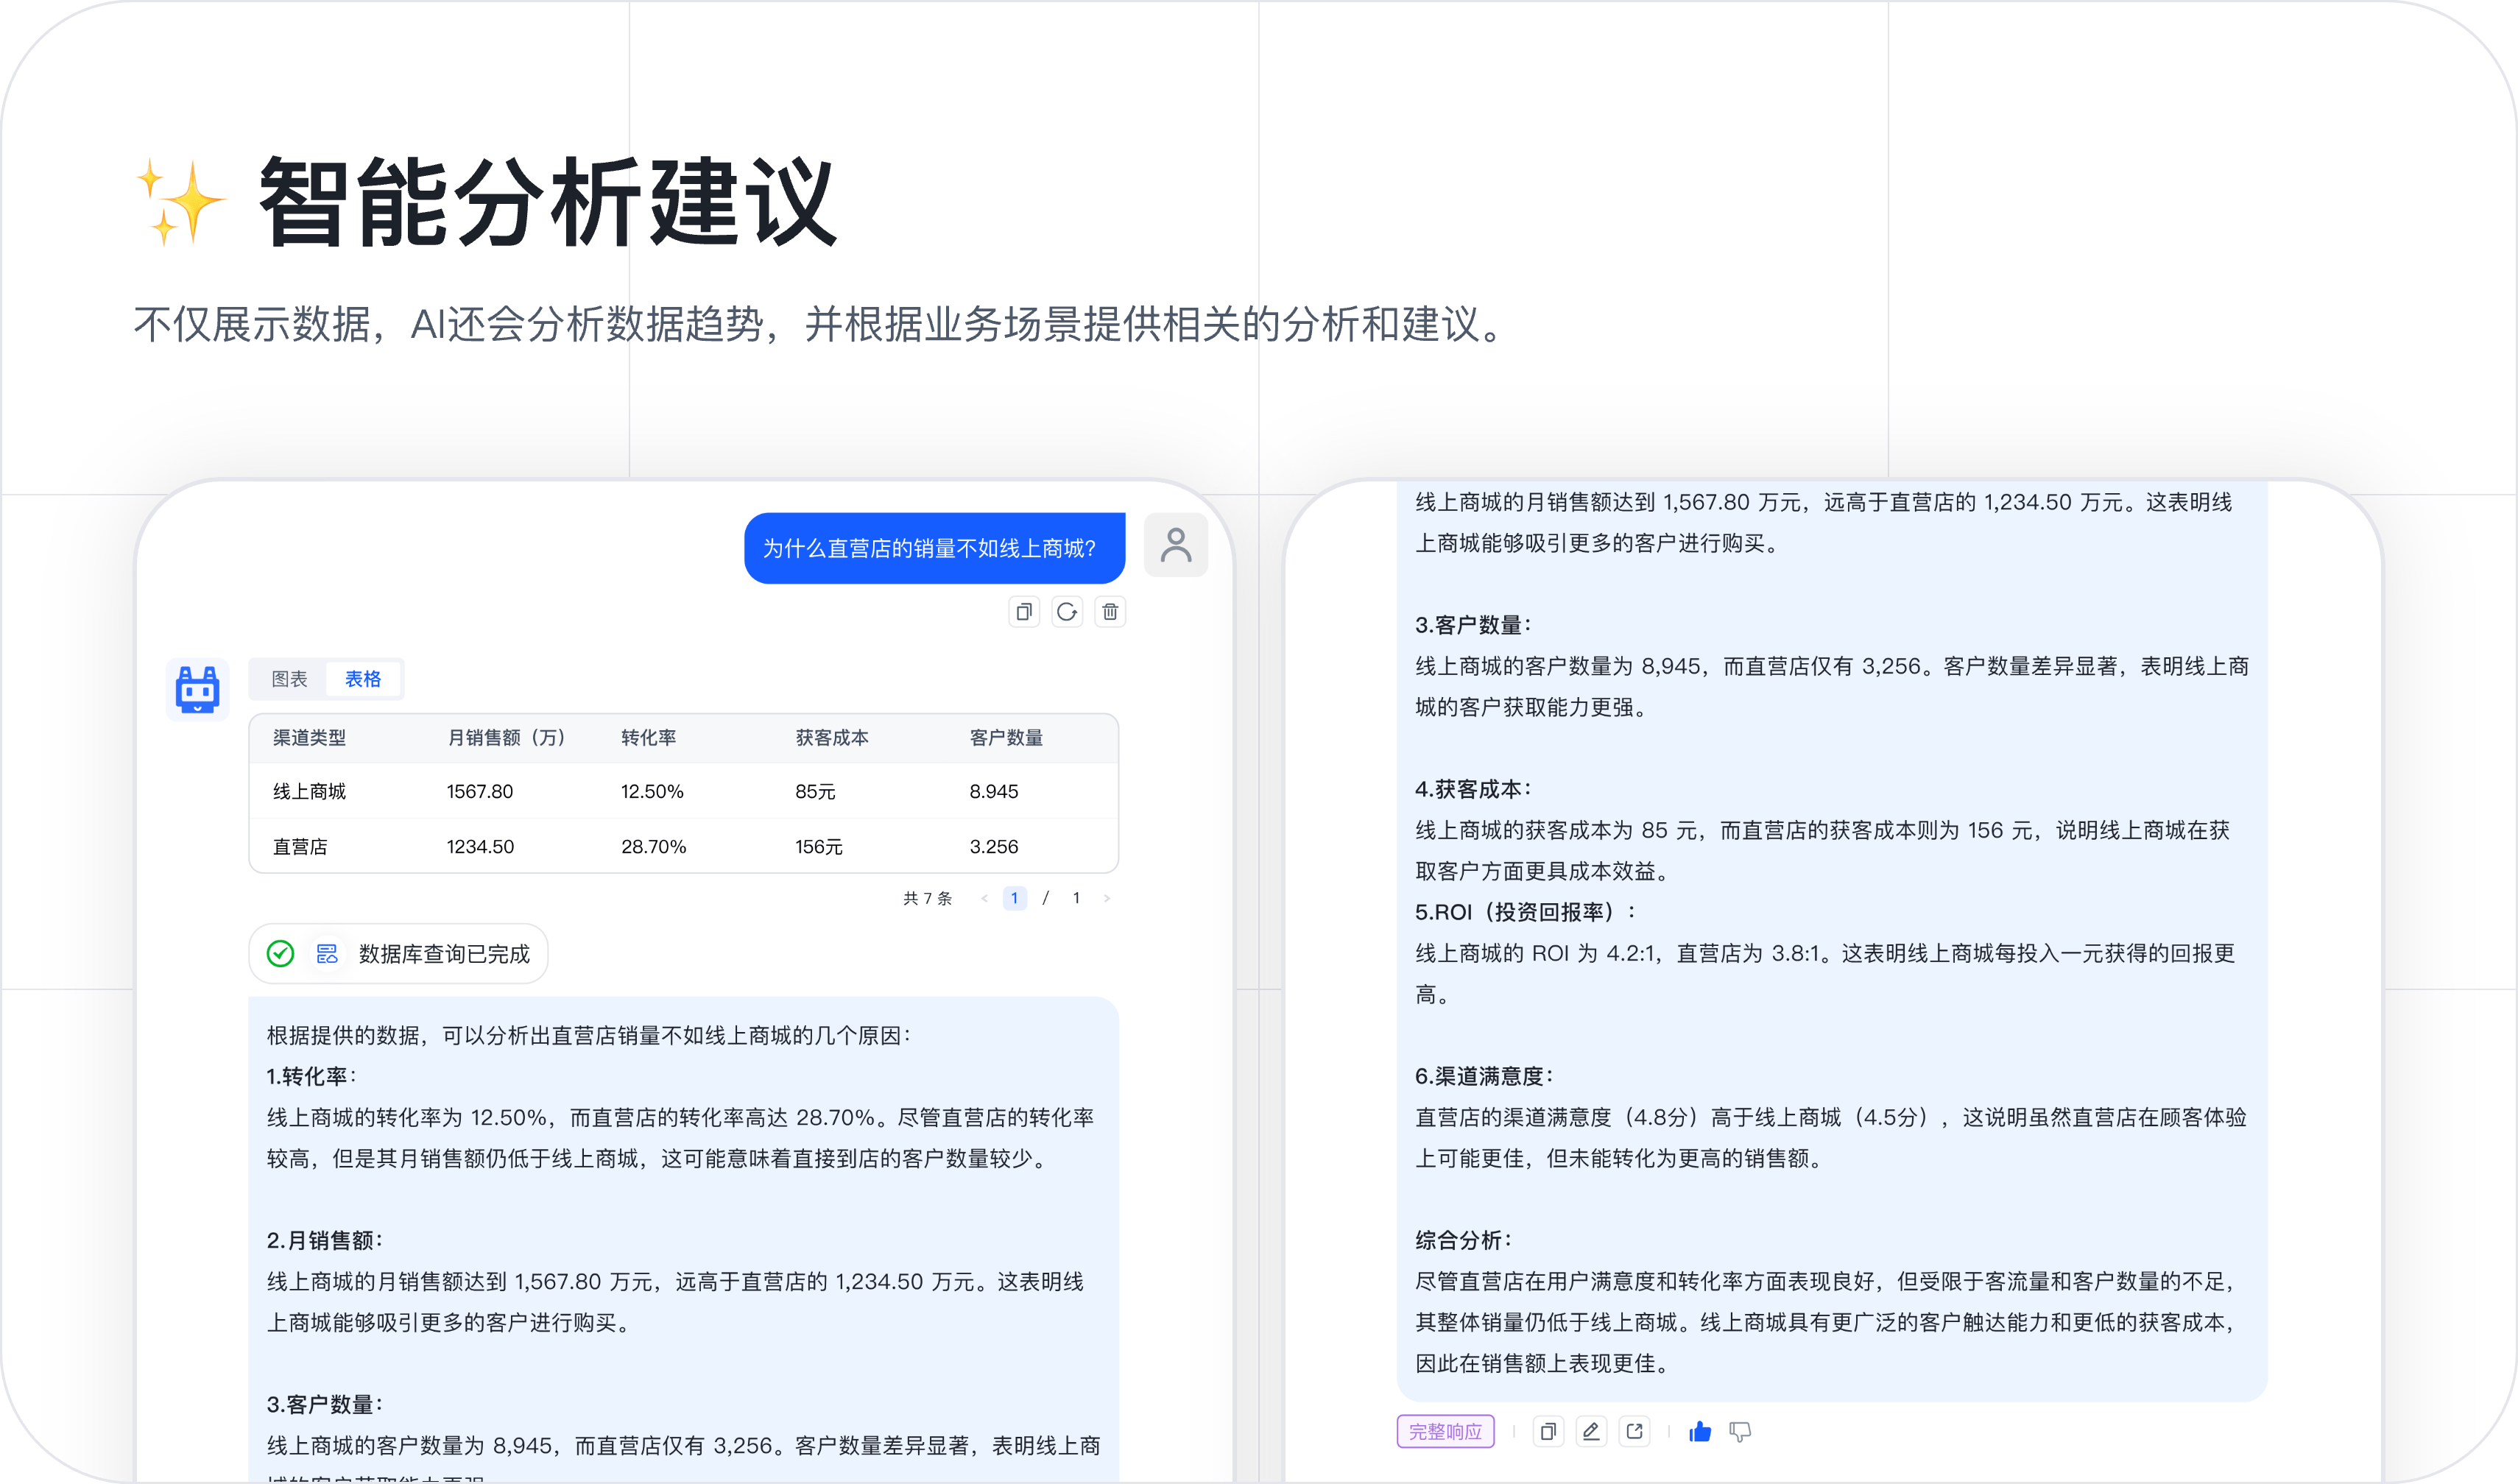
Test assumptions and investigate the reasons behind changes in your business.
Business use cases
Make data-driven decisions and improve operational efficiency
Sales performance
Ask for sales data in natural language and get timely insights without waiting for a report.
Ask and explore
Ask a question and retrieve sales data directly.
Explore from different angles
Analyze by region, product, time and other dimensions.
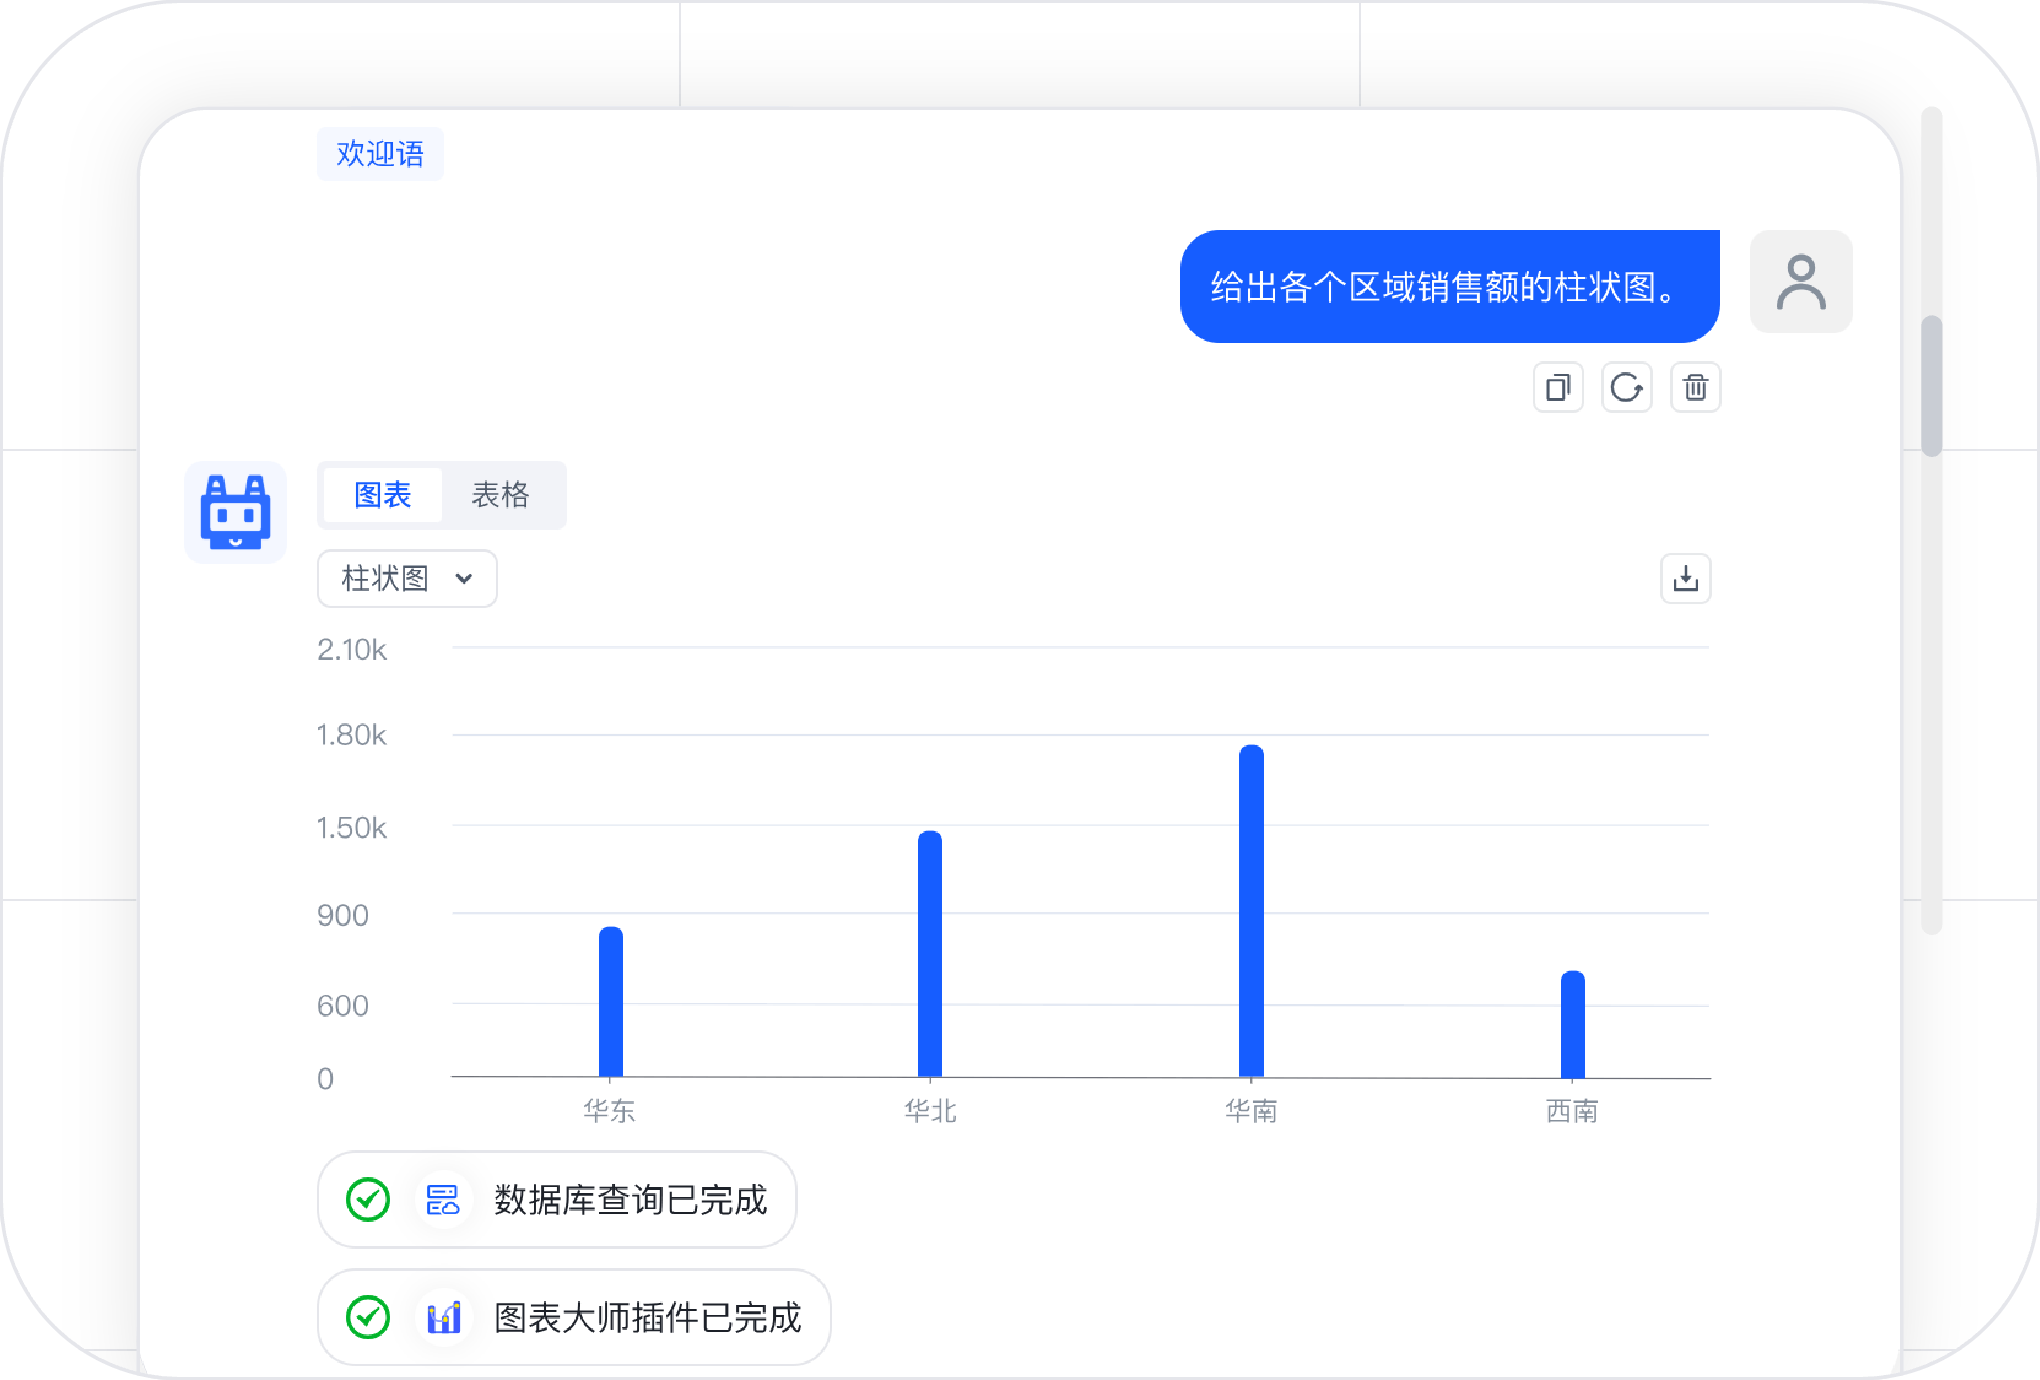
Example shown in the Chinese product interface.
Financial analysis
Explore costs, profit and cash flow without building every report manually.
Financial metrics
Ask about margins, cash flow and cost structure.
Period comparisons
Spot trends with year-over-year and month-over-month comparisons.
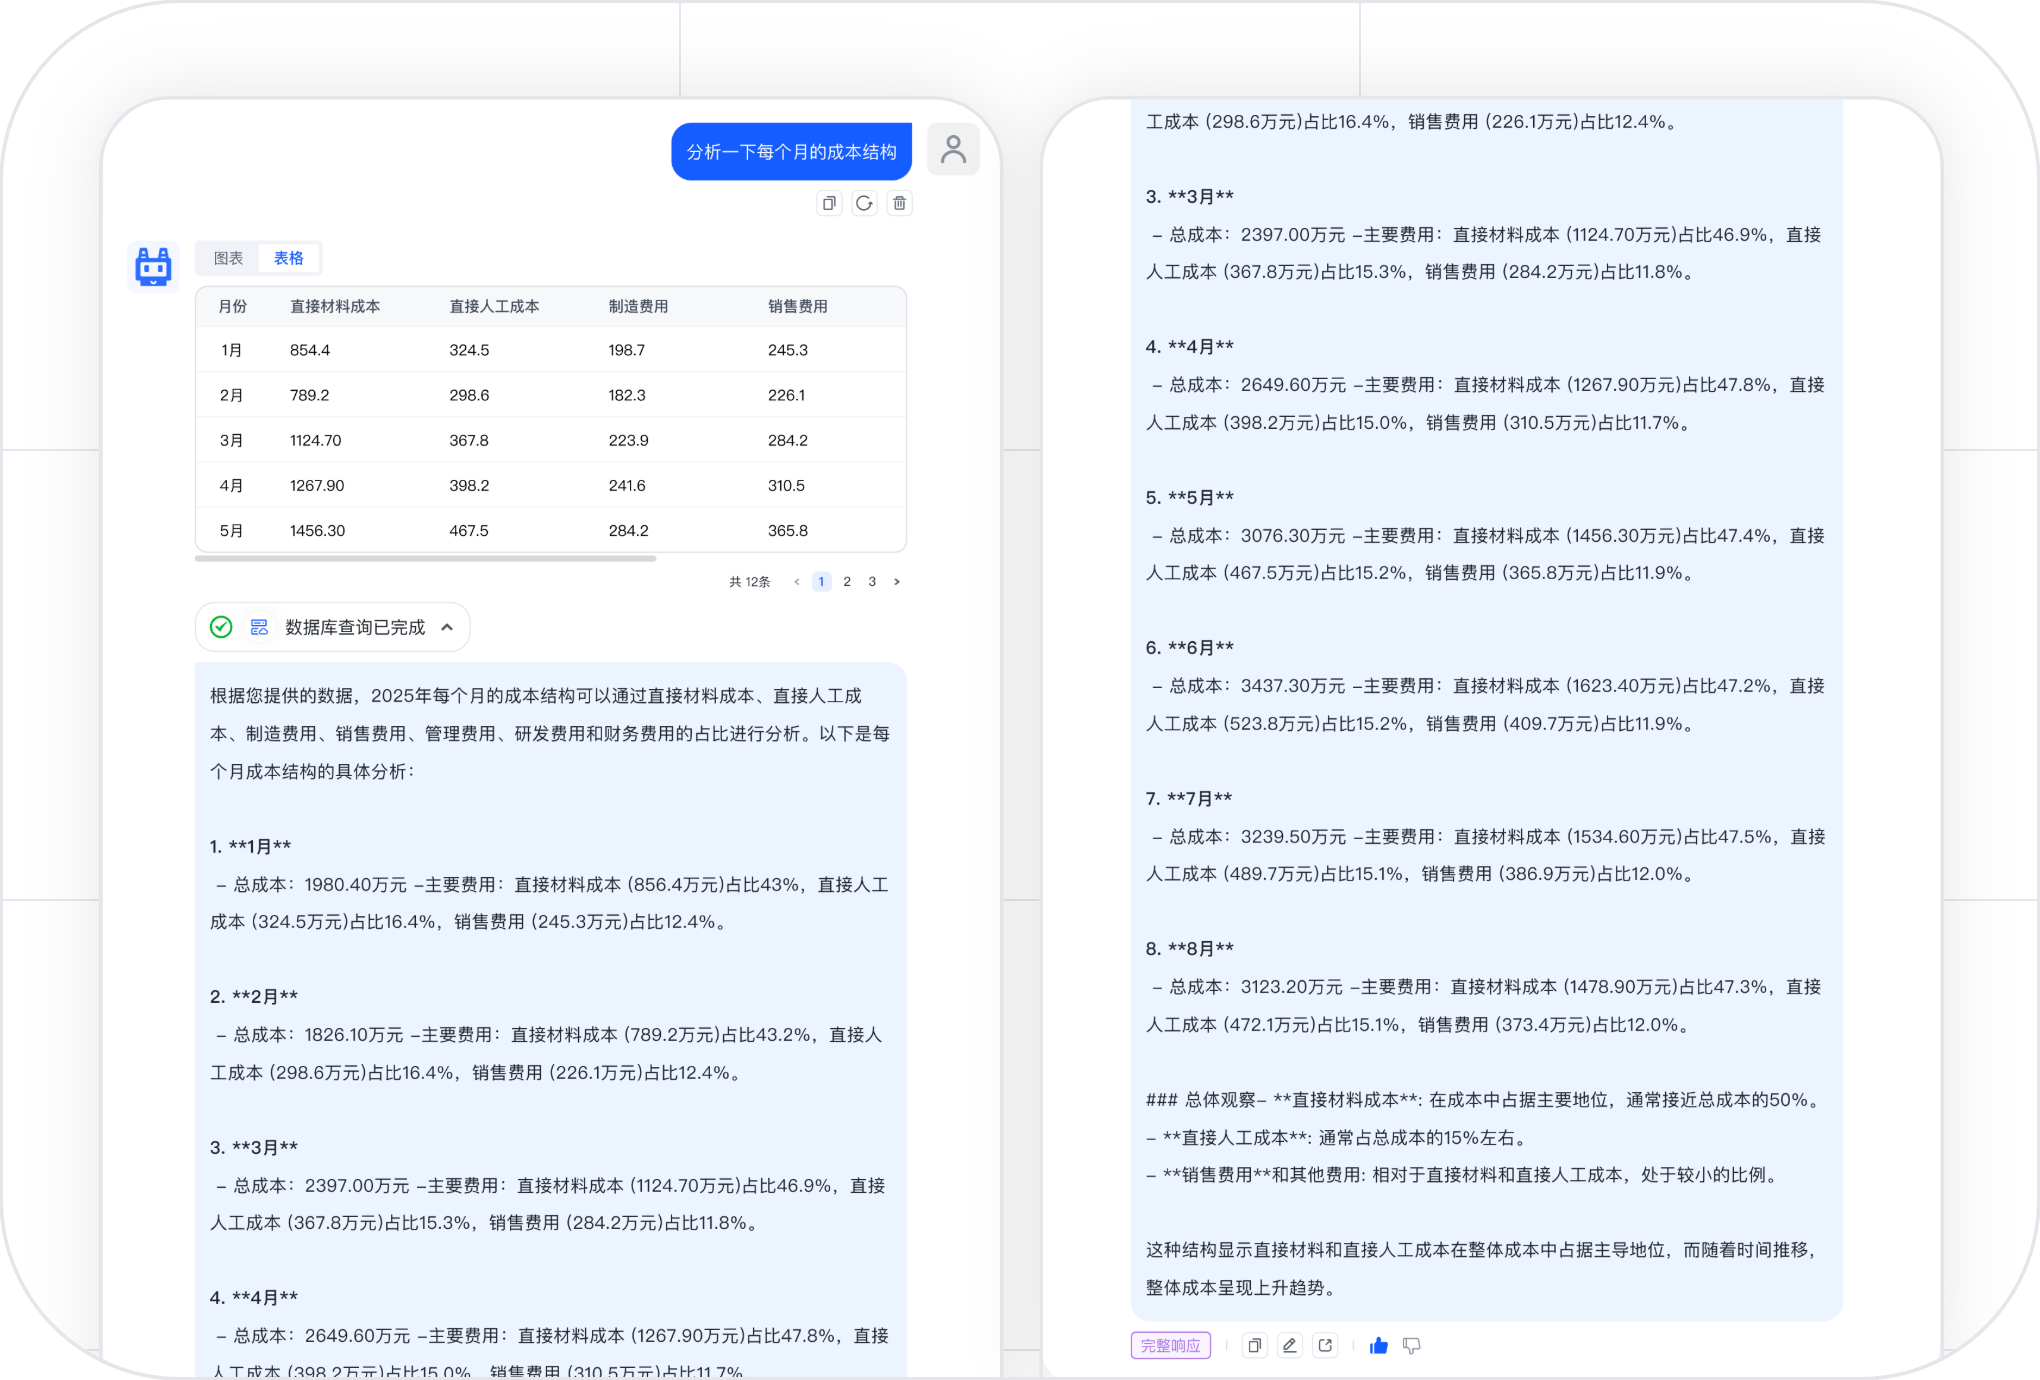
Example shown in the Chinese product interface.
Market insights
Explore customers, products and channels to inform marketing decisions.
Product insights
Analyze bestsellers, inventory turnover and price sensitivity.
Channel performance
Compare conversion rates, acquisition costs and ROI.
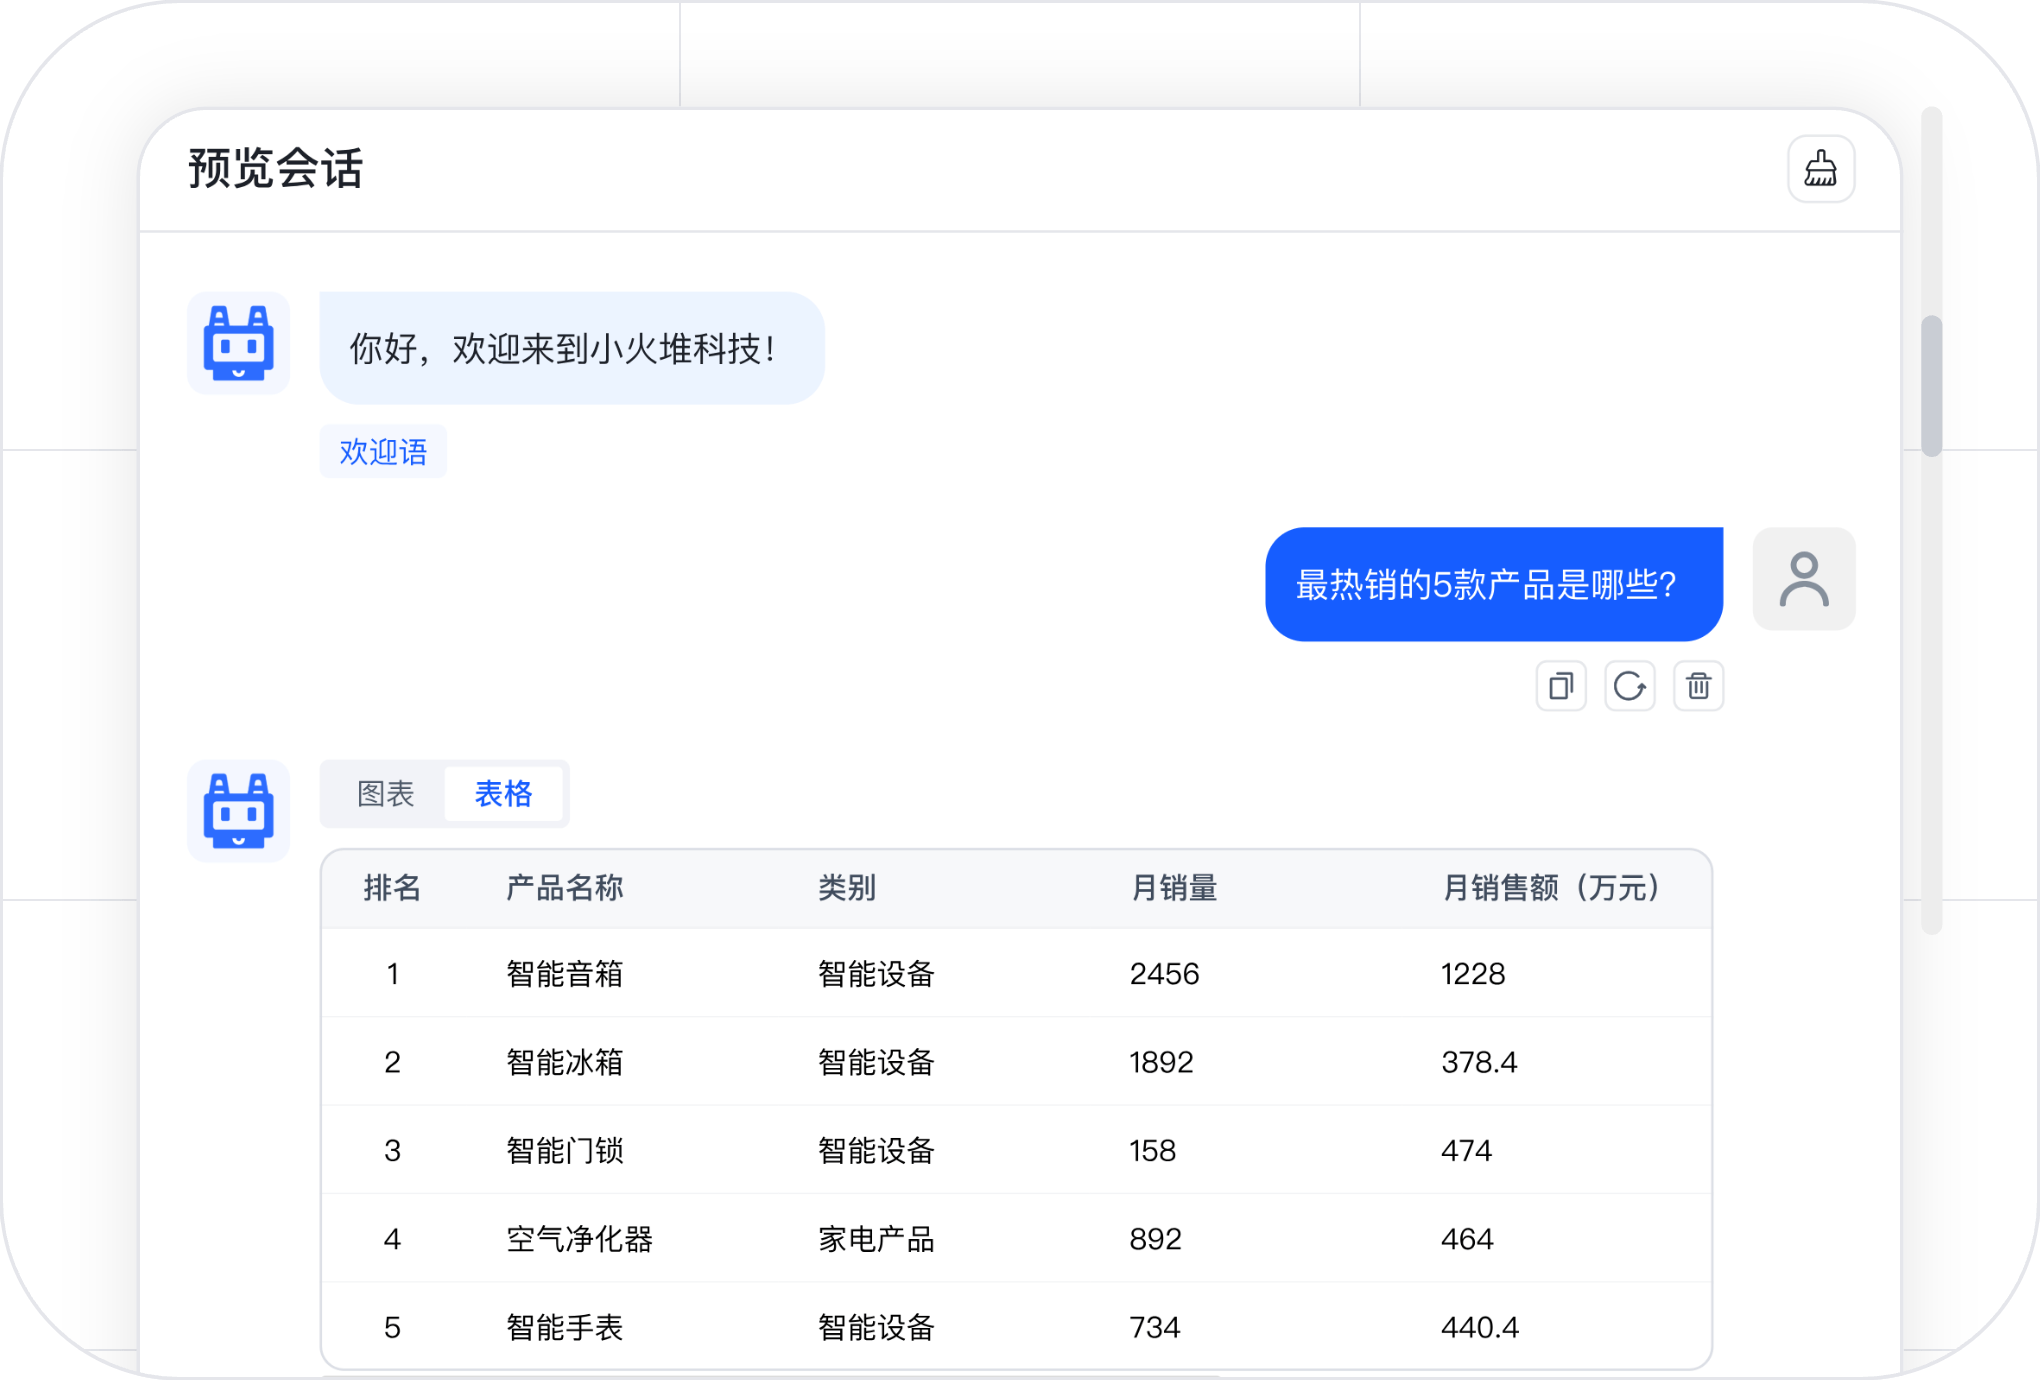
Example shown in the Chinese product interface.
Operational efficiency
Explore supply chains, inventory and workforce metrics to identify bottlenecks.
Inventory optimization
Check turnover, slow-moving stock and replenishment needs.
Workforce analysis
Compare employee performance, department efficiency and labor costs.
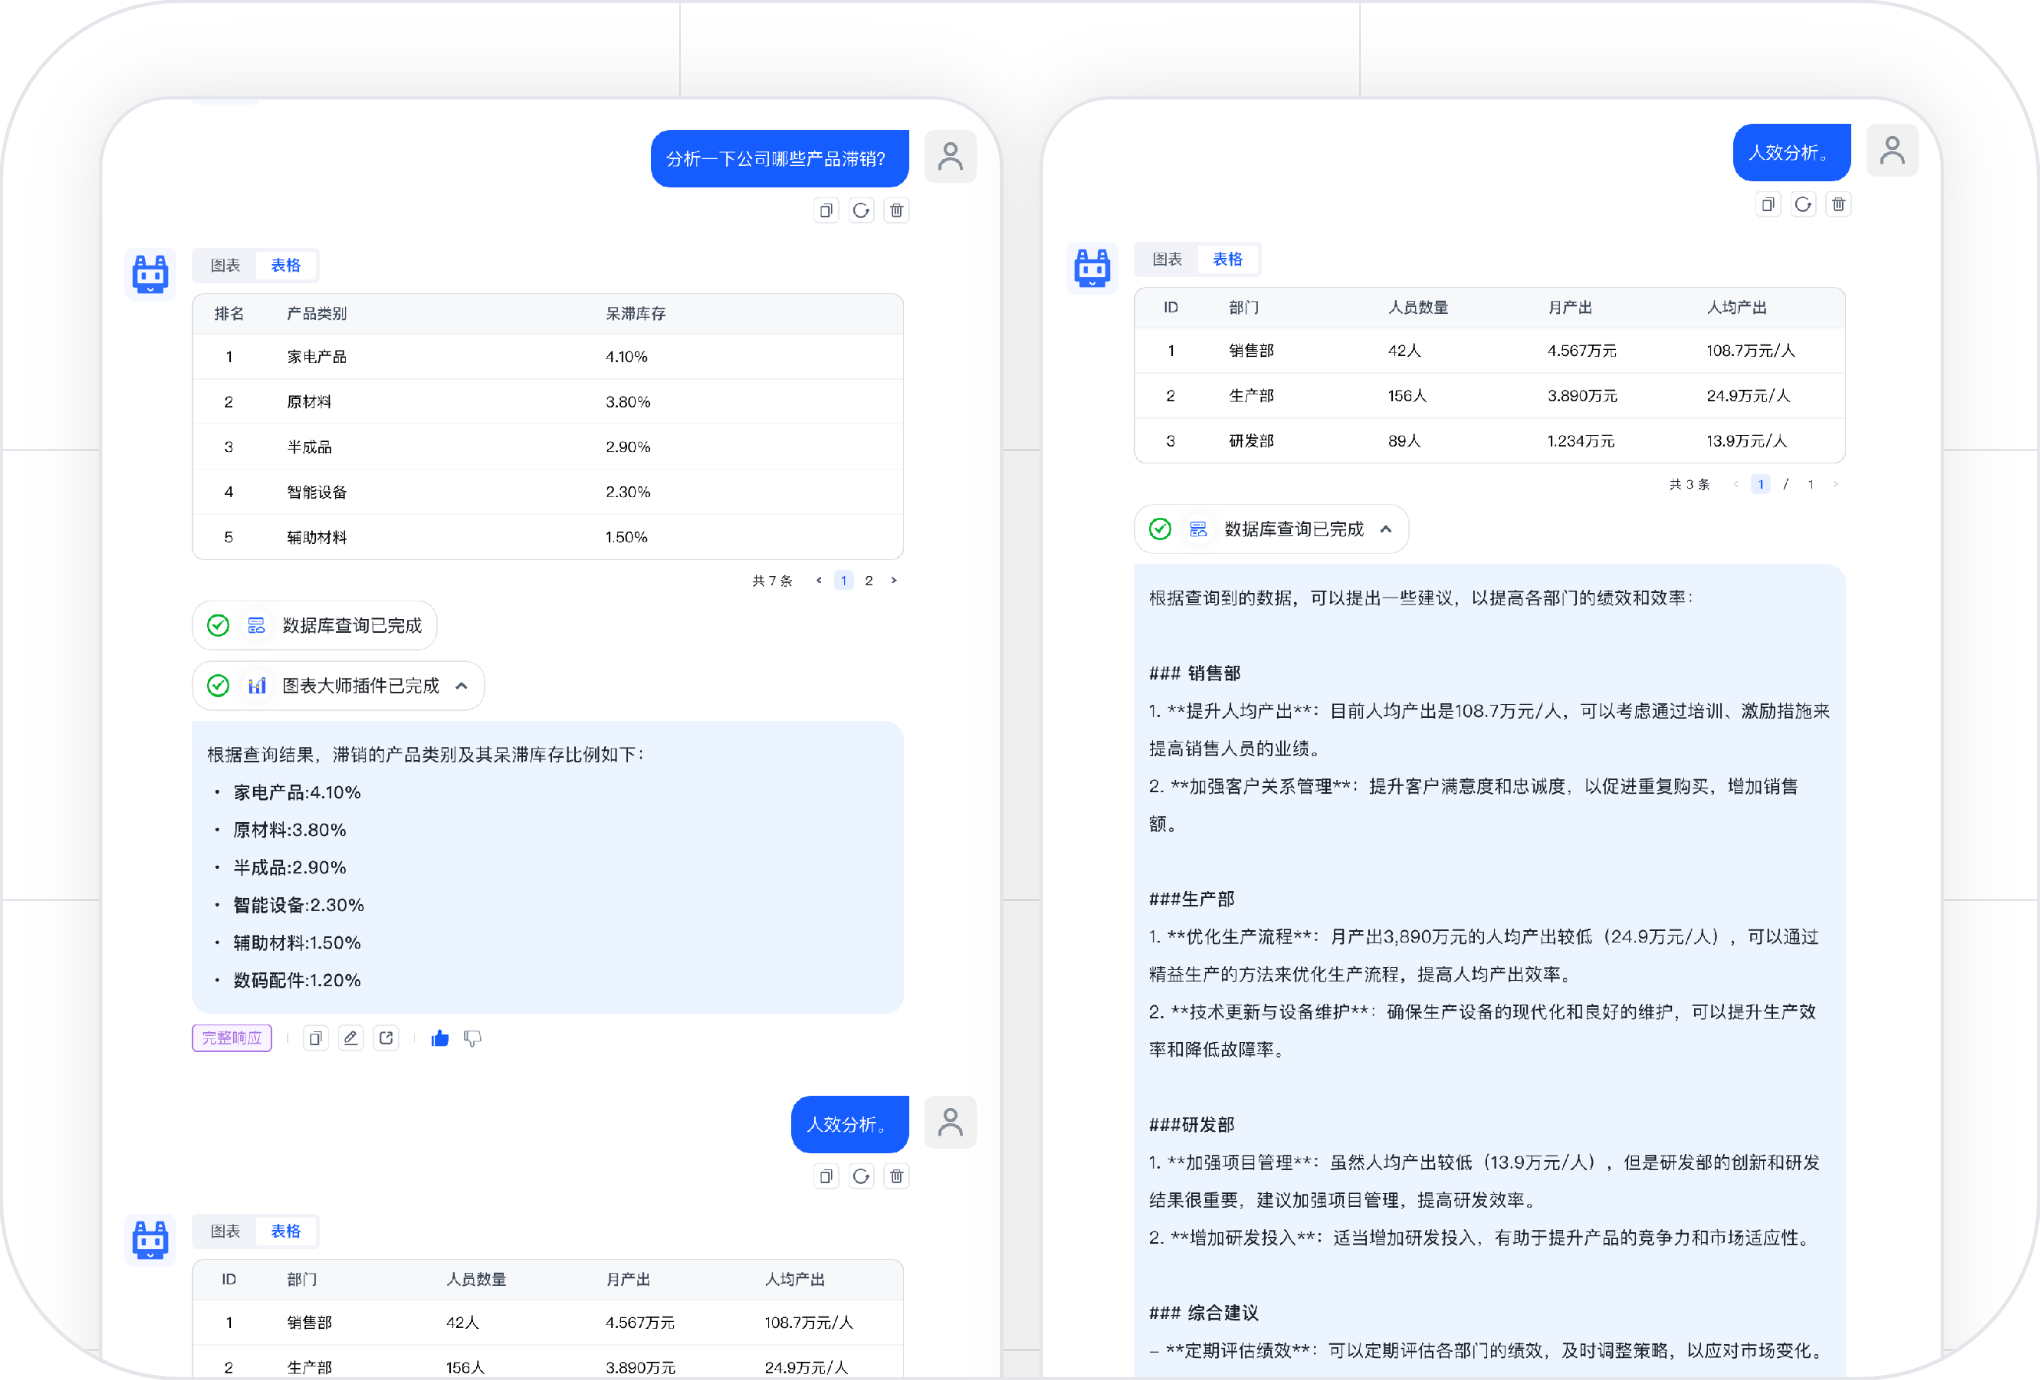
Example shown in the Chinese product interface.
Built for everyday data analysis
Help your team find, understand and use business data.
3min
From question to insight
Ask in your own words
90%↑
Faster decisions
Make data part of everyday work
Flexible
charts and tables
Turn query results into charts
Connected
business systems
Access data from the systems you already use
Ready to ask your first question?
Tell us which data sources and business questions you want to explore. We can help you evaluate a setup.
Request a trial